
- Published 14 Jan, 2026
- Updated 02 May, 2026
- read
- Karolinehc
- Reviewed by: Karolinehc
- Editor: Karolinehc
Categories: Marketing Analytics Python Projects
Tags: Data-driven Decisions Python Data Visualization Customer Conversion Marketing Campaign Matplotlib Pandas Seaborn
The content presented in this article is intended solely for academic purposes. The opinions expressed are based on my personal understanding and research. It’s important to note that the field of big data and the programming languages discussed, such as Excel, Python, R, Power BI, Tableau, and SQL, are dynamic and constantly evolving. This article aims to foster learning, exploration, and discussion within the field rather than provide definitive answers. Reader discretion is advised.
Why This Facebook Engagement Campaign Was Built
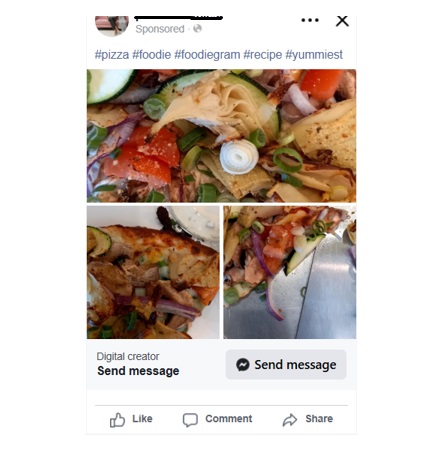
This campaign was designed to increase interaction around food-related creative content. The goal was engagement: reactions, comments, shares, and other visible actions.
Meta describes engagement campaigns as campaigns intended to help people interact with a business or content. That makes this campaign type useful when the objective is audience response rather than immediate sales.
Campaign Results
The campaign combined food and drink interest targeting with a post engagement objective.
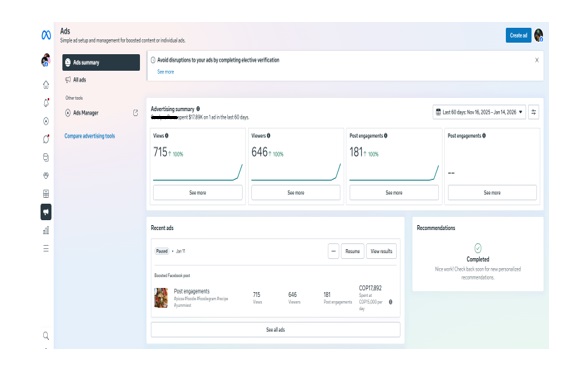
Key results:
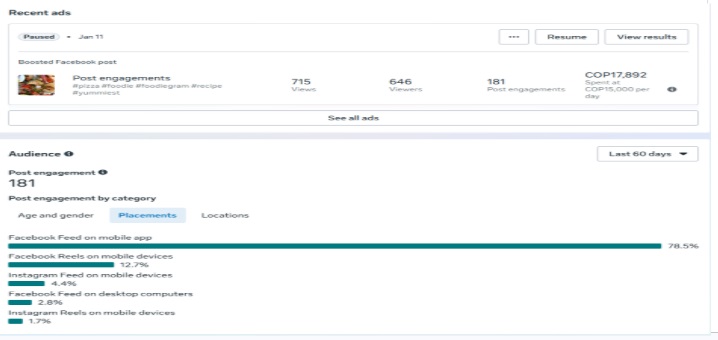
- 715 total views
- 646 people reached
- 181 interactions, including likes, comments, and shares
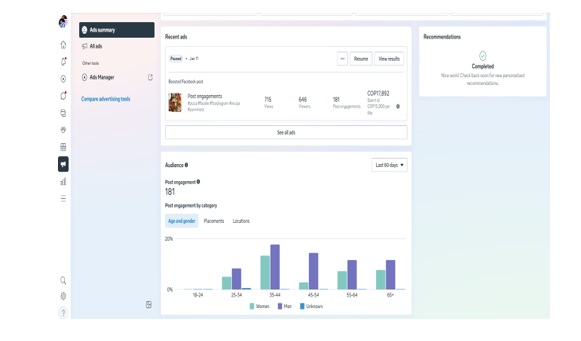
How Audience Segments Responded
The 35-44 age group was the strongest engagement driver. Younger segments showed moderate growth, while older segments stayed more stable.
This segment became the campaign’s primary performance opportunity because it combined reach with stronger response.
Placement And Device Insights
Mobile dominated delivery. More than 95% of engagement occurred on mobile devices.
Facebook Feed produced the largest share of placements, followed by Facebook Reels and Instagram Feed. This pattern suggests that mobile-first creative and short, readable copy are important for similar campaigns.
Geographic Insights
Engagement was concentrated in high-population states:
- California generated 11% of total engagement.
- Florida generated 8.3%.
- Texas generated 6.6%.
The campaign appeared to resonate more in large urban markets where food culture and digital media consumption overlap.
What This Means For Campaign Optimization
The strongest pattern is clear: interest-based targeting, mobile-first delivery, and algorithmic placement expansion produced concentrated engagement among mid-age urban audiences.
For future campaigns, the next step would be to test creative variations for the 35-44 segment and compare performance across Feed, Reels, and Instagram placements.
Frequently Asked Questions
Why use a post engagement campaign?
A post engagement campaign is useful when the goal is to increase reactions, comments, shares, and content interaction instead of direct conversions.
What made this campaign perform well?
The campaign combined food-related audience interests, mobile-heavy delivery, and analysis by age group, placement, and geography to find the strongest engagement segments.