- Published 19 Jul, 2026
- Updated 19 Jul, 2026
- read
- Karolinehc
- Reviewed by: Karolinehc
- Editor: Karolinehc
Categories: Financial Analysis Investing
Tags: Data Visualization Diversification Efficient Frontier Monte Carlo Simulation Portfolio Optimization Python Risk Management Sharpe Ratio Stock Market Tech Stocks Yahoo Finance
The content presented in this article is intended solely for academic purposes. The opinions expressed are based on my personal understanding and research. It’s important to note that the field of big data and the programming languages discussed, such as Python,Excel, R, Power BI, Tableau, and SQL, are dynamic and constantly evolving. This article aims to foster learning, exploration, and discussion within the field rather than provide definitive answers. Reader discretion is advised.
Between 2013 and 2023 Tech Companies transformed the world. Artificial intelligence is exploded, streaming changed entertainment, cloud computing became essential, some stocks soared others struggled. However, the biggest lesson was not who won it was how diversification changed the game.
The Efficient Frontier graph displays the trade-off between expected returns (y-axis) for different portfolio allocations (it is the finished cake, the outcome) for 10 years from 2013-2023 (Yahoo Finance data), after using the method Monte Carlo simulations which is the recipe, the process we use. Each poitn represents a different portfolio of assets and the X-asis (Volatility) represents the risk of the portfolio. The Color gradient reflects the Sharpe ratio a measure of risk-adjusted return (green dots= higher Sharpe, better Sharpe ratio which means good return, lower risk, red dots = lower Sharpe, worse Sharpe ratio which means either low return, high risk or both).
Monte Carlo simulations are a powerful tool used to understand the impact of risk and uncertainty in prediction and forecasting models. They use randomness to solve problems that might be deterministic (trying every single ticker we will know the best however it could take forever) in principle. Monte Carlo in Finance is used to model the behavior of financial markets, assess risk, price derivatives and evaluate investment portfolios.
Every investor wants to reach the summit. Higher returns. More wealth but every step comes with steeper cliffs. This curve is like a mountain trail. Bellow it you are taking unnecessary risk, above it you cannot go. The goal is not to climb recklessly it is to find the safest path to the highest point.
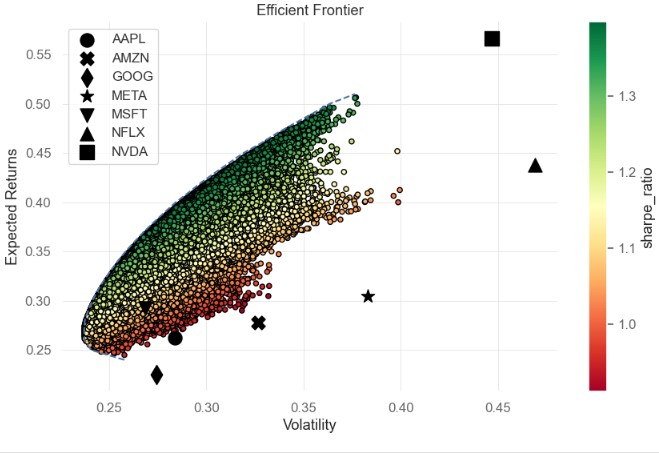
Here the Efficient Frontier (the outcome) shows the best combinations of investment that give us the most return for the least risk.
Return: How much money we make from an investment (like % profit)
Risk/Volatility: How much the price goes up and down (the Bigger the swings, the riskier it is)
Sharpe Ratio: A score that combines return and risk. Higher = better balance between profit and risk.
The Shapes: (stars, circles, triangles) are the individual companies (tickers)
Good investment are not just about big profits; they also need to be less risky.
Green = Best combo of profit + safety
Red = Either too risky or not enough return
Imagine investing in technology in 2013. Artificial intelligence was still mostly a research topic. Netflix was know for streaming movies. Microsof was trying to reinvent itself. Nvidia was primary recognized for making graphics cards for gamers. Few people could have predicted what the next ten years would bring. Yet those years would become one of the most transforming decades in modern history. Apple building an Ecosystem, Amazon beyond online shopping, Google organizing the digital world, Meta connecting billions, Microsoft one of the greats comebacks, Netflix reinventing Entertainment, Nvidia the surprise leader as result the World was chaging too.
Historical Stock Prices │ ▼ Calculate daily returns │ ▼ Monte Carlo Simulation (Randomly generate thousands of portfolios) │ ▼ For each portfolio calculate: • Expected Return • Volatility (Risk) • Sharpe Ratio │ ▼ Plot every portfolio as a dot │ ▼ Identify the best portfolios │ ▼ Efficient Frontier
At the same time, events and conditions (like inflation, war, politics, geopolitics, new technologies) change how sectors behave. Historical events are one of the most important questions in investing. Stock prices do not just move because of company’s profits; they are also influence by the world around them
| Year | Event | Sources |
|---|---|---|
| 2013–2016 | Low interest rates | Federal Reserve, FRED |
| 2016–2018 | Cloud computing growth | Microsoft annual reports, Gartner, Reuters |
| 2018 | U.S.–China trade tensions | Reuters, AP News |
| 2020 | COVID-19 pandemic | WHO, Reuters, Microsoft annual report |
| 2020–2021 | Government stimulus | Federal Reserve, IMF |
| 2022 | Inflation & rate hikes | Federal Reserve, BLS |
| 2022 | Russia–Ukraine war | Reuters, UN, NATO |
| 2023 | AI boom | Microsoft, NVIDIA investor relations, Reuters |
2013. Seven Companies stood before you. Apple AAPL, Amazon AMZN, Google GOOG, Meta META, Microsoft MSFT, Netflix NFLX, Nvidia NVDA, you have no idea which one would dominate the next decade. Most people think successful investing is about picking the winner. However, this chart tells a different story. It shows that the greatest investors are not fortune tellers. They are risk managers.
Let’s break down the analysis of the individual assets and the implications for portfolio construction:
MSFT(Microsoft) Location, in the middle of the scatter plot, closer to the greener points indicating a higher Sharpe ratio.
NFLX(Netflix) Location, Towards the top right corner, possibly an outlier with high risk (volatility) and potentially high return.
META (formerly Facebook) Location, in the middle of the scatter plot, also an outlier.
AMZN(Amazon) Location, Bellow the main cluster of points.
GOOG(Alphabet) Location, To the left and below the main cluster of points.
AAPL(Apple) Location, partially touching the main cluster of points at the beginning.
Implications and Investment Decision coming up!.
Frequently Asked Questions
What is the Efficient Frontier?
The Efficient Frontier is a curve that shows the optimal portfolio allocations that offer the highest expected return for a given level of risk. Portfolios below the frontier are inefficient.
What is a Monte Carlo simulation in investing?
A Monte Carlo simulation uses random sampling to model thousands of possible portfolio outcomes. It helps investors understand risk, uncertainty, and the range of potential returns.
Why is the Sharpe ratio important?
The Sharpe ratio measures risk-adjusted return. A higher ratio means better returns per unit of risk — it helps investors compare investments with different risk levels.
Why is diversification important?
Diversification spreads risk across different assets. As the 2013-2023 tech decade shows, even individual winners like Nvidia were unpredictable — a diversified portfolio reduces the impact of any single stock’s performance.