
- 26 Jan, 2026
- read
- Karolinehc
Categories: Marketing Analytics Python Projects
Tags: Customer Conversion Data Visualization Marketing Campaign Pandas Seaborn Matplotlib Data-driven Decisions Python
The content presented in this article is intended solely for academic purposes. The opinions expressed are based on my personal understanding and research. It’s important to note that the field of big data and the programming languages discussed, such as Python, R, Power BI, Tableau, and SQL, are dynamic and constantly evolving. This article aims to foster learning, exploration, and discussion within the field rather than provide definitive answers. Reader discretion is advised.
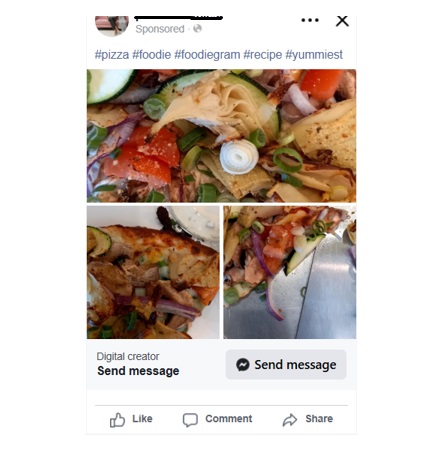
When running a Facebook post engagement campaign, the objective isn’t just visibility — it’s interaction. This campaign was designed with one clear goal:
Maximize engagement across a United States audience using a structured and data-driven approach.
From the beginning, the campaign was built inside Meta Ads Manager with the Post Engagement objective selected. That decision instructed the algorithm to prioritize users most likely to react, comment, and interact with the content rather than simply view it.
Campaign Setup and Targeting Strategy
The ad was targeted exclusively to the United States, ensuring budget efficiency within a single geographic market. Instead of broad guessing, we used structured targeting layers:
Age: 18+
Interest categories aligned with food and lifestyle content
Behavioral filters focused on digital activity and mobile usage
Advantage+ placements activated for optimized delivery
By allowing Meta’s algorithm to distribute placements automatically, we enabled the system to prioritize where engagement probability was highest.
Device Performance: Mobile Dominated
One of the strongest insights came from placement performance data.
78.5% of engagement came from Facebook Feed on mobile devices
Facebook Reels on mobile contributed approximately 12%
Instagram Feed engagement was moderate
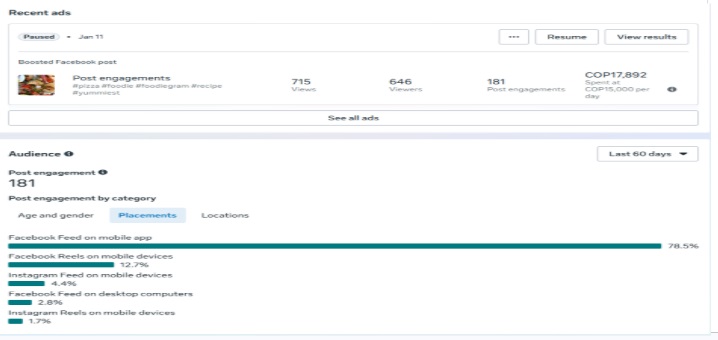
Desktop placements accounted for minimal interaction
This confirmed a key strategic takeaway: mobile-first creative design was critical. The campaign succeeded because visuals were optimized for scrolling behavior on smartphones.
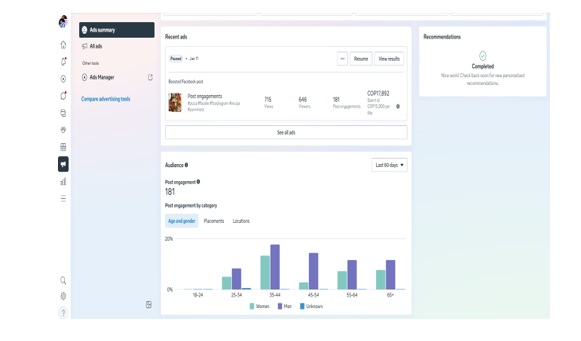
Gender and Age Insights
Audience breakdown showed the highest engagement within the 25–44 age range. Both men and women interacted, with slightly stronger performance within the 25–34 and 35–44 brackets.
Younger users (18–24) showed lower engagement, while older segments (55+) displayed steady but moderate interaction.
This data validates that the campaign resonated most with working-age adults actively consuming content on mobile feeds.
State-Level Performance Across the U.S.
Geographic performance added another layer of clarity.
The top responding states were:
California (11%)
Florida (8.3%)
Texas (6.6%)
New York (5%)
Illinois (5%)
These high-population states drove the majority of engagement, demonstrating that targeting within the United States was not only broad but strategically effective in key markets.
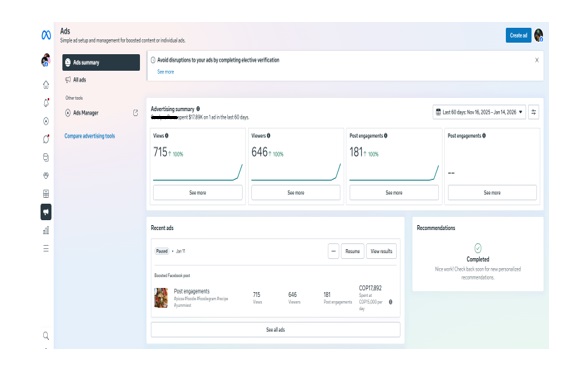
Final Results
Within the campaign cycle, performance delivered:
715 views
646 reach
181 post engagements
Total spend: COP 17,892
📈 For a controlled budget campaign, this level of interaction confirms that structured targeting, optimized placements, and mobile-focused creatives drive measurable engagement.!