- 23 Mar, 2023
- read
- Karolinehc
Categories: Visualización de Datos Proyectos en Python
Tags: Ifood Dataset Datos de Clientes Pandas Matplotlib Seaborn Kaggle Análisis de Marketing Limpieza de Datos
El contenido presentado en este artículo está destinado únicamente para fines académicos. Las opiniones expresadas se basan en mi comprensión e investigación personal. Es importante tener en cuenta que el campo de los grandes datos y los lenguajes de programación discutidos, como Python, R, Power BI, Tableau y SQL, son dinámicos y están en constante evolución. Este artículo tiene como objetivo fomentar el aprendizaje, la exploración y la discusión dentro del campo en lugar de proporcionar respuestas definitivas. Se recomienda la discreción del lector.
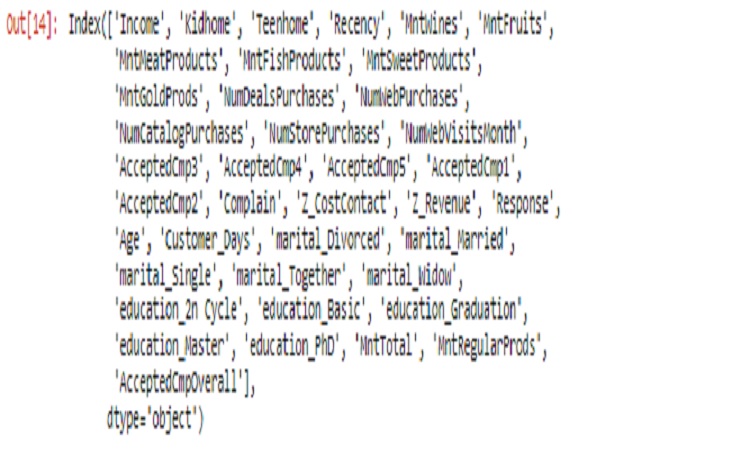
marketing1.columns
OUTPUT
marketing1['marital_Divorced'].unique()
OUTPUT
array([0, 1], dtype=int64)
marketing1['education_Basic'].unique()
OUTPUT
array([0, 1], dtype=int64)
marketing1['kidhome'].unique()
OUTPUT
array([0, 1, 2], dtype=int64)
marketing1['AcceptedCmp5'].unique()
OUTPUT
array([0, 1], dtype=int64)
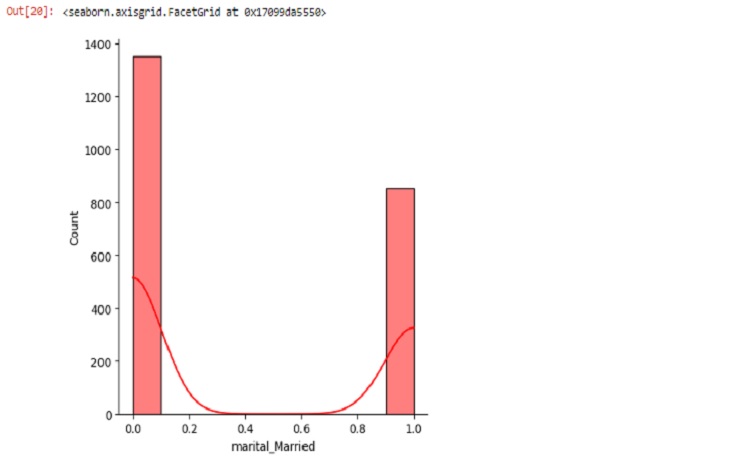
sns.displot(marketing1.marital_Married, bins=10, kde=True, color='red')
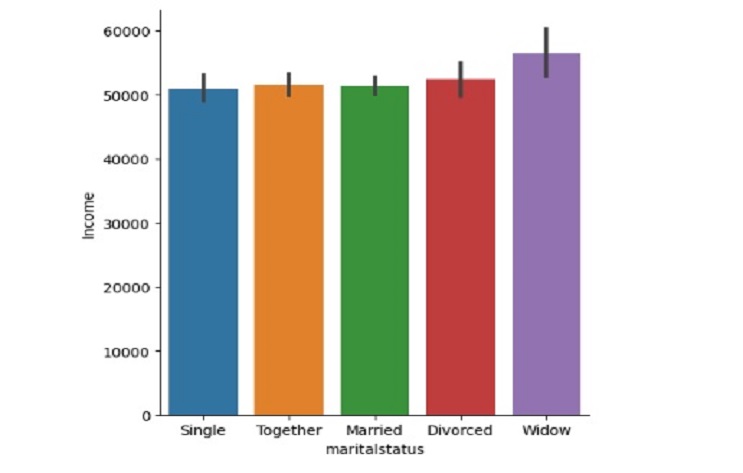
marital
Creando nuevos string Columnas para el actual int64 Columna
Vamos a convertir algunas variables de dtype int64 like: marital , education , _home and AcceptedCmp1 to string para hacer más comprensible la visualización.
import numpy as np

marital_mapping = {
    0: 'Not Divorced',
    1: 'Divorced',
    0: 'Not Together',
    1: 'Together',
    0: 'Not Widow',
    1: 'Widow',
    0: 'Not Single',
    1: 'Single',
    0: 'Not Married',
    1: 'Married'
}

marketing1['maritalstatus'] = np.where(marketing1['marital_Divorced'] == 1, 'Divorced', 'Not Divorced')
marketing1['maritalstatus'] = np.where(marketing1['marital_Married'] == 1, 'Married', marketing1['maritalstatus'])
marketing1['maritalstatus'] = np.where(marketing1['marital_Single'] == 1, 'Single', marketing1['maritalstatus'])
marketing1['maritalstatus'] = np.where(marketing1['marital_Together'] == 1, 'Together', marketing1['maritalstatus'])
marketing1['maritalstatus'] = np.where(marketing1['marital_Widow'] == 1, 'Widow', marketing1['maritalstatus'])
Apliquemos el mismo código para obtener la variable de educación y los niveles también.
marketing1.loc[0,'Customer_Days']
OUTPUT
2822
En el caso anterior, necesitamos cambiar el actual dtype int65 to a datetime porque Customer_Days es una date variable
marketing1['Customer_Days'] = pd.to_numeric(marketing1['Customer_Days'], errors='coerce')
marketing1['Customer_Days'] = pd.to_datetime(marketing1['Customer_Days'], origin='1970-01-01', unit='D')

start_date = pd.to_datetime('1976-01-01')
end_date = pd.to_datetime('1977-12-31')

accurate_dates = marketing1[(marketing1['Customer_Days'] >= start_date) & (marketing1['Customer_Days'] <= end_date)]['Customer_Days']
#vamos a cambiar de int dtype to string dtype (Object) the new follow variables
marketing1['maritalstatus'] = marketing1['maritalstatus'].astype(str)
marketing1['education'] = marketing1['education'].astype(str)
marketing1['campaing'] = marketing1['campaing'].astype(str)
marketing1['family'] = marketing1['family'].astype(str)
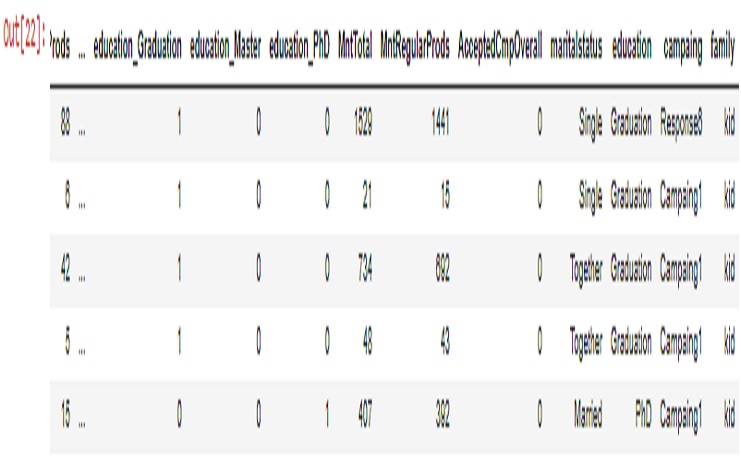
marketing1.head()
OUTPUT
graphic_date.plot(x='Customer_Days', y='Income', kind = 'line')
OUTPUT
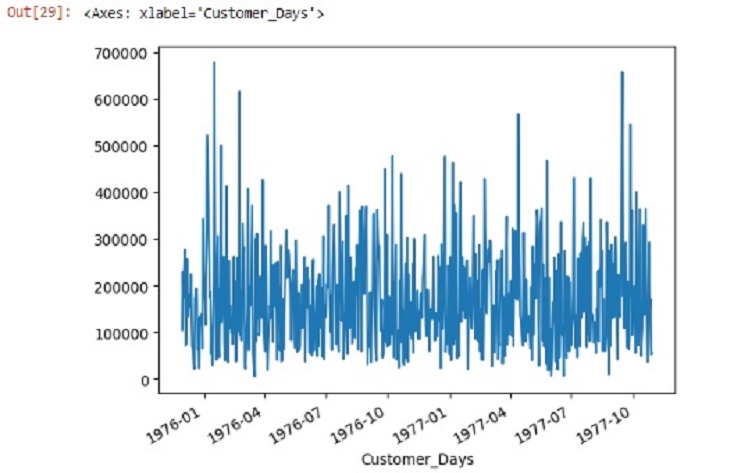
graphic_date.plot(x='Customer_Days', y='Income', kind = 'line')
OUTPUT
graphic_date.plot(x='Customer_Days', y='Income', kind = 'line')
OUTPUT
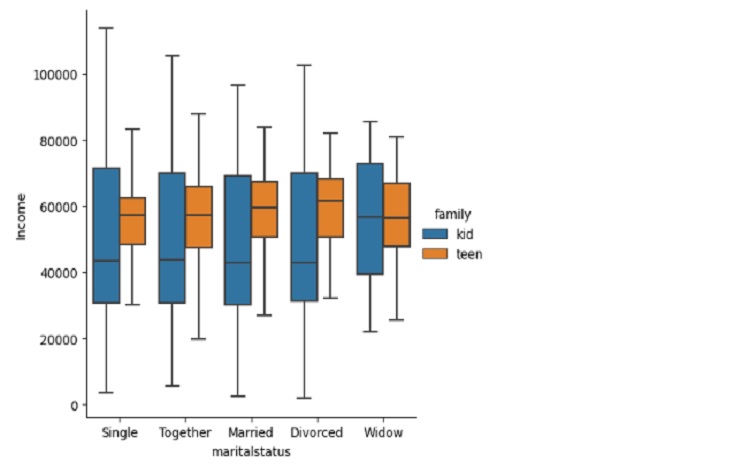
sns.catplot(x='maritalstatus',
y='Income',
data=marketing1,
kind='box',
hue='family',
sym="")
plt.show()
OUTPUT
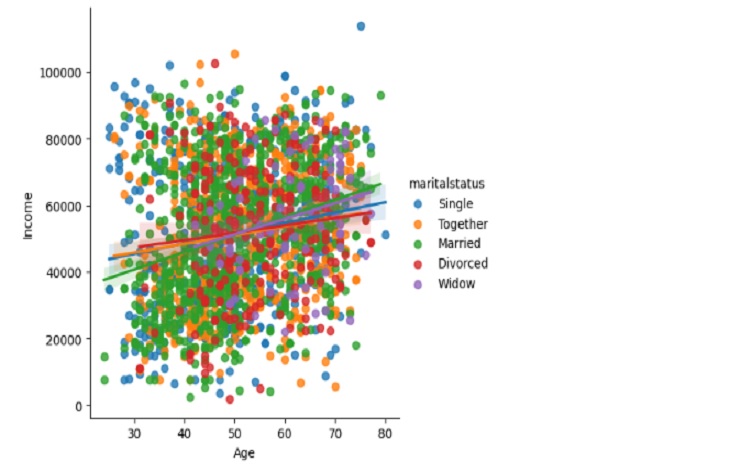
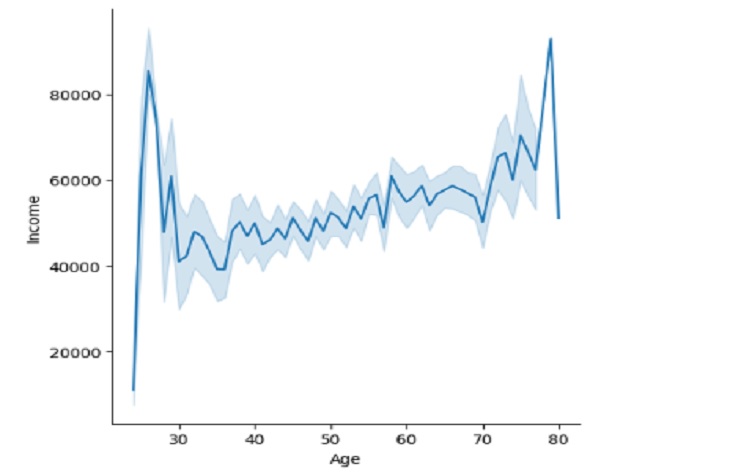
sns.lmplot(data=marketing1,
            x="Age",
            y="Income",
            hue="maritalstatus")
plt.show()
OUTPUT