- Published 14 Mar, 2023
- Updated 14 Mar, 2023
- read
The content presented in this article is intended solely for academic purposes. The opinions expressed are based on my personal understanding and research. It’s important to note that the field of big data and the programming languages discussed, such as Python, R, Power BI, Tableau, and SQL, are dynamic and constantly evolving. This article aims to foster learning, exploration, and discussion within the field rather than provide definitive answers. Reader discretion is advised.
1. WorkbookName
2. ToolbarSection
3. Cards and Shelves
4. ViewSection
5. SecctionData Colors and Marks
6. Sheet
7. Tab
8. Tab
9. Dimensions and Measures
10. Toolbar
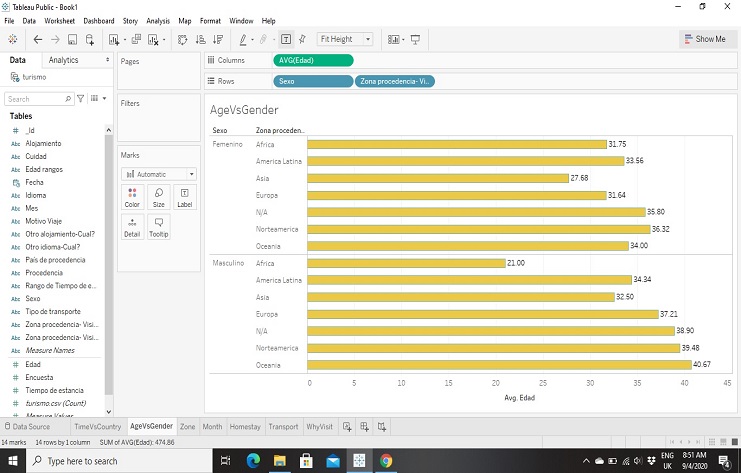
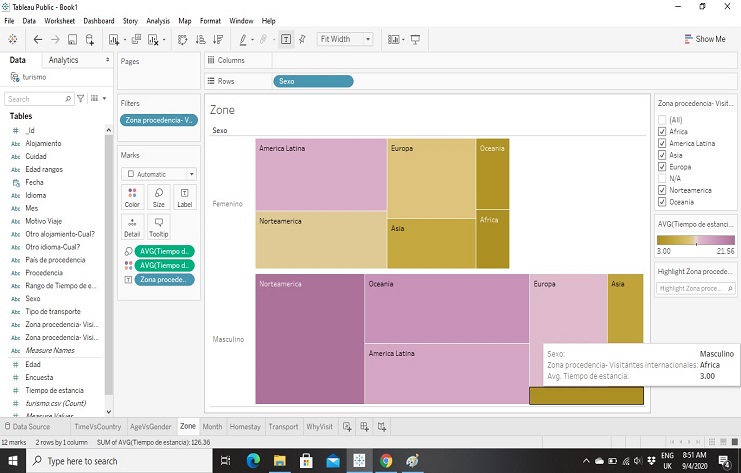
Demographic Age Vs Gender By Country
Average time to stay by Gender and Country
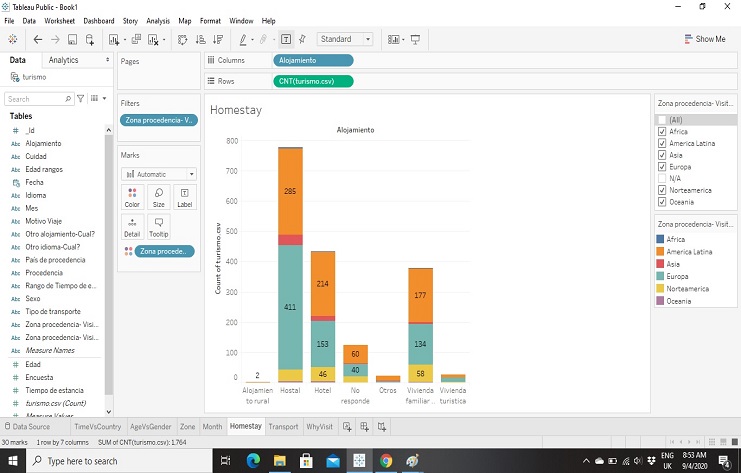
Accommodation
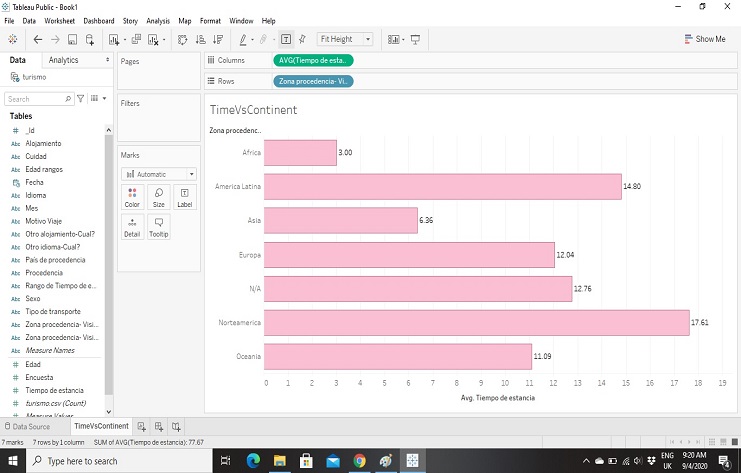
From which continent do people stay the longest
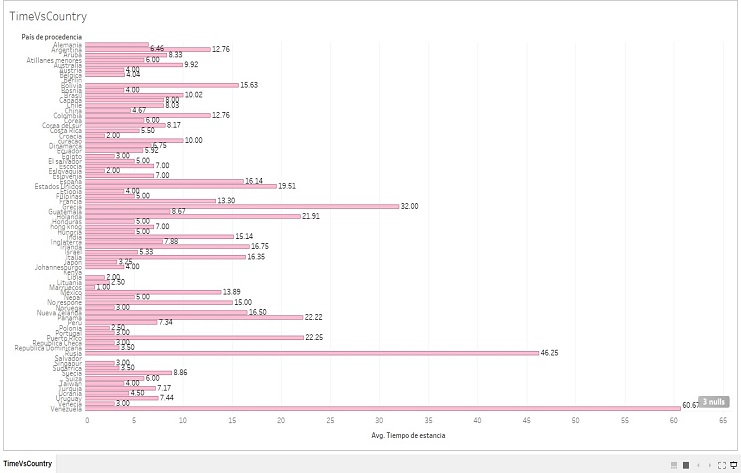
From which country do people stay the longest
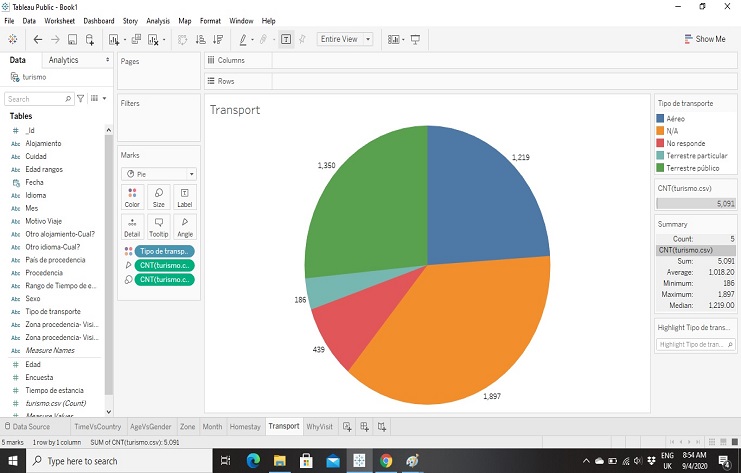
Transport took to travel
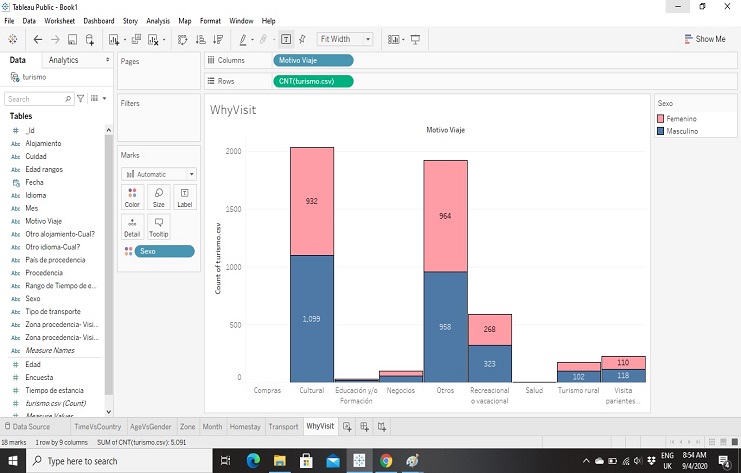
Reason for travel by gender