
- Published 27 Jul, 2026
- Updated 27 Jul, 2026
- read
- karoline_hc
- Reviewed by: karolinehc
- Editor: karolinehc
Categories: Data Analysis Meta Ads Paid Media Performance Marketing
Tags: Ad Spend Optimization Audience Targeting Budget Allocation Click-Through Rate Cost Per Result Digital Marketing KPIs Facebook Ads Gender Marketing Gender Performance Instagram Ads Marketing Analytics Meta Ads Paid Social Performance Marketing ROI Optimization
The content presented in this article is intended solely for academic purposes. The opinions expressed are based on my personal understanding and research. It’s important to note that the field of big data and the programming languages discussed, such as Excel, Python, R, Power BI, Tableau, and SQL, are dynamic and constantly evolving. This article aims to foster learning, exploration, and discussion within the field rather than provide definitive answers. Reader discretion is advised.
Meta Ads Gender Performance Analysis: Why Female Audiences Deliver 32% Lower Cost Per Result
Introduction
When analyzing Meta ad performance, understanding how different genders respond to our campaigns is essential for budget optimization. This guide breaks down the key performance indicators (KPIs) for gender-based reporting using real campaign data.
The Data:
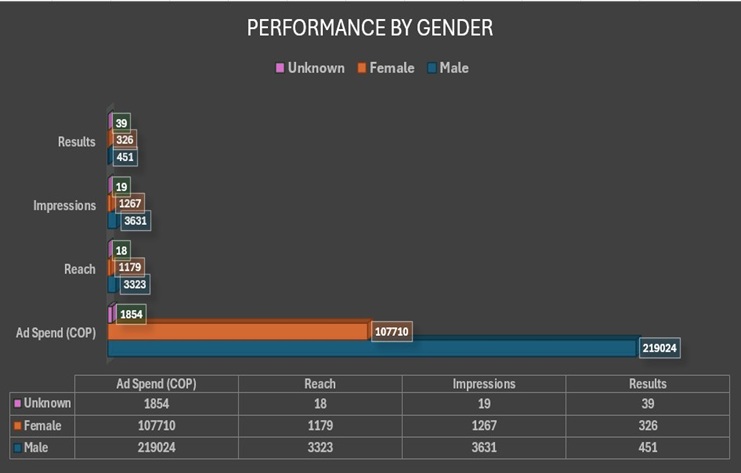
Key Performance Indicators (KPIs) by Gender
1. Ad Spend
Definition: Total money invested in reaching each gender audience.
| Gender | Ad Spend | % of Total Budget |
|---|---|---|
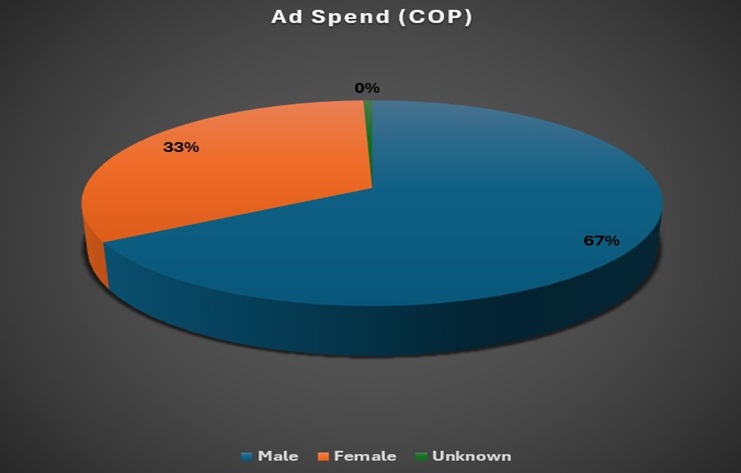
| Male | 219,024 | 67% |
| Female | 107,710 | 33% |
Interpretation: Male audiences receive two-thirds of the total budget. Female audiences receive the remaining one-third.
Question to ask: Is this allocation aligned with our business goals?
2. Reach
Definition: The number of unique people who saw our ad at least once.
| Gender | Reach |
|---|---|
| Male | 3,323 |
| Female | 1,179 |
Interpretation: Male campaigns reached nearly 3x more unique people than Female campaigns.
3. Impressions
Definition: The total number of times our ad was displayed (including multiple views to the same person).
| Gender | Impressions |
|---|---|
| Male | 3,631 |
| Female | 1,267 |
Interpretation: Male ads generated nearly 3x more total views than Female ads.
4. Results
Definition: The number of completed actions (depends on our campaign objective — could be purchases, leads, link clicks, engagements, etc.).
| Gender | Results |
|---|---|
| Male | 451 |
| Female | 326 |
Interpretation: Male campaigns delivered 38% more results than Female campaigns.
However, Female campaigns achieved this with only 33% of the budget.
5. Click-Through Rate (CTR)
Definition: The percentage of people who clicked on your ad after seeing it.
Formula: CTR = (Clicks ÷ Impressions) × 100
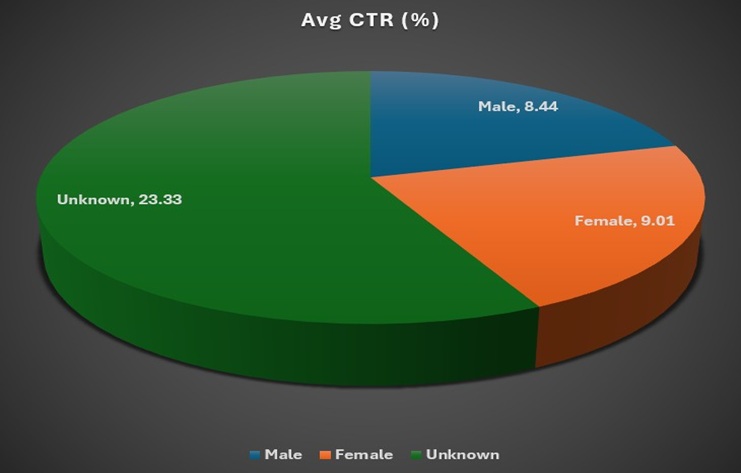
Interpretation: Female audiences have a slightly higher CTR (9.01%) compared to Male audiences (8.44%). This means Female viewers are more likely to engage with the ad when they see it.
For Context:
- Meta average CTR: 0.90% - 2.00%
- Our CTRs (8-9%) are excellent and indicate strong ad creative.
Advanced KPIs (Derived Metrics)
Cost per Result
Definition: How much you pay for each completed action.
Formula: Cost per Result = Ad Spend ÷ Results
| Gender | Ad Spend | Results | Cost per Result |
|---|---|---|---|
| Male | 219,024 | 451 | 486 COP |
| Female | 107,710 | 326 | 330 COP |
Interpretation:
- Female campaigns are 32% cheaper per result than Male campaigns.
- Female delivers results at 330 COP each vs Male at 486 COP each.
Frequency
Definition: The average number of times a unique person saw our ad.
Formula: Frequency = Impressions ÷ Reach
| Gender | Impressions | Reach | Frequency |
|---|---|---|---|
| Male | 3,631 | 3,323 | 1.09 |
| Female | 1,267 | 1,179 | 1.07 |
Interpretation: Both genders have low frequency (around 1.0), meaning:
- Most people saw the ad only once
- We are reaching unique audiences rather than showing the same ad repeatedly
- No audience fatigue yet
Result Rate
Definition: The percentage of people who completed the desired action after seeing the ad.
Formula: Result Rate = (Results ÷ Reach) × 100
| Gender | Results | Reach | Result Rate |
|---|---|---|---|
| Male | 451 | 3,323 | 13.57% |
| Female | 326 | 1,179 | 27.65% |
Interpretation:
- Female audiences convert at double the rate of Male audiences
- 27.65% of women who see the ad take action vs only 13.57% of men
Summary Performance per Gender
| KPI | Male | Female | Better Outcome |
|---|---|---|---|
| Investment | 219.024 (67%) | 107.710 (33%) | Male (more budget) |
| Reach | 3.323 | 1.179 | Male (3x more) |
| Impresions | 3.631 | 1.267 | Male (3x more) |
| Leads | 451 | 326 | Male (total) |
| CTR | 8.44% | 9.01% | ✅ female (cheaper) |
| Cost per Result | 486 COP | 330 COP | ✅ Female (cheaper) |
| Frecuency | 1.09 | 1.07 | Similar |
| Lead Conversion Rate | 13.57% | 27.65% | ✅ Female (double) |
Key Takeaways for Stakeholders
| Female audiences have higher CTR (9.01% vs 8.44%)|
| Female creative is more engaging |
| Female audiences have lower Cost per Result (330 COP vs 486 COP)|
| Female campaigns are more efficient |
| Female audiences have higher Result Rate (27.65% vs 13.57%)|
| Women are twice as likely to convert |
| Female campaigns receive only 33% of the budget |
| Consider reallocating budget toward Female audiences |
| Unknown gender (18 people) has extremely high CTR (23.33%) but tiny sample size|
| Ignore this — statistical insignificance |
Actionable Recommendations
“Reallocate 15-20% of Male budget to Female audiences."
Why:
- Female delivers results at 32% lower cost
- Female has 2x higher conversion rate (Result Rate)
- Current budget split (67/33) does not match performance efficiency
Questions for Further Analysis
| Question | Why It Matters |
|---|---|
| What is the “Result” type? | |
| Determines if we’re tracking purchases, leads, or clicks | |
| Is the higher Female performance due to creative or targeting? | |
| Helps optimize future campaigns | |
| What is the sample size over time? | |
| Ensures we’re not overreacting to daily fluctuations |
Ready to optimize your Meta Ads budget? Start by analyzing your own gender performance data and look for similar efficiency gaps.
Questions or comments? Drop them below! 👇
Data retrieved from Meta Ads Manager. Analysis performed on campaign data 2026.
Frequently Asked Questions
What is CTR (Click-Through Rate) in Meta Ads?
CTR measures the percentage of people who click on your ad after seeing it. It’s calculated as (Clicks ÷ Impressions) × 100. A higher CTR indicates your ad creative is more engaging. Industry average CTR for Meta Ads is 0.90% to 2.00%. Our analysis shows 8-9% CTR, which is exceptional.
What does Cost per Result mean in Meta Ads?
Cost per Result tells you how much you pay for each completed action (purchase, lead, link click, etc.). It’s calculated as Ad Spend ÷ Results. Lower cost per result indicates more efficient campaigns. In our analysis, female audiences achieved 330 COP per result vs 486 COP for male.
How do I calculate Frequency in Meta Ads?
Frequency is calculated as Impressions ÷ Reach. It tells you how many times the average person saw your ad. Frequency below 2.0 means you’re reaching unique audiences with minimal repetition. Higher frequency (>3.0) can lead to ad fatigue.
What is a good CTR for Meta Ads?
A good CTR for Meta Ads is typically 1% to 2%. Anything above 2% is considered strong. Our analysis shows 8.44% for male audiences and 9.01% for female audiences — both are exceptionally high and indicate excellent ad creative.
Why are female audiences more efficient in Meta Ads?
Our data shows female audiences have 32% lower cost per result (330 COP vs 486 COP), 2x higher result rate (27.65% vs 13.57%), and higher CTR (9.01% vs 8.44%). This means women are more likely to engage with ads and convert at lower costs.
What is the difference between Reach and Impressions?
Reach is the number of unique people who saw your ad at least once. Impressions is the total number of times your ad was displayed (including multiple views to the same person). The ratio of Impressions to Reach gives you Frequency.
How much budget should I allocate to female audiences?
Based on our analysis, female audiences receive only 33% of the budget but deliver superior performance. We recommend shifting 15-20% of male budget to female audiences. This could increase total results by approximately 10-15% without increasing total spend.
What is Result Rate in Meta Ads?
Result Rate measures the percentage of people who completed the desired action after seeing your ad. It’s calculated as (Results ÷ Reach) × 100. A higher result rate means your ad is more effective at converting viewers into customers.
What should I do with Unknown gender data?
Unknown gender data typically comes from users who haven’t specified their gender or are not detected by Meta’s algorithm. With only 18 people in our analysis, this sample is too small (statistically insignificant) and should be ignored for decision-making.
When should I reallocate budget between genders?
Reallocate budget when you see consistent performance differences over 7-14 days. Look at Cost per Result, CTR, and Result Rate trends. If female audiences consistently outperform male audiences, shift budget gradually (10-20% at a time) to test the impact.
Why should I analyze gender performance separately?
Analyzing gender performance separately helps you: 1) Identify which audience is more efficient, 2) Optimize ad creative for each gender, 3) Allocate budget to highest ROI audience, 4) Understand audience behavior differences, and 5) Maximize overall campaign performance.
What KPIs should I track for gender analysis?
Essential KPIs for gender analysis include: Ad Spend, Reach, Impressions, Results, CTR, Cost per Result, Frequency, and Result Rate. These metrics together tell you who is engaging, converting, and delivering the best ROI.