- Published 17 Jun, 2026
- Updated 17 Jun, 2026
- read
- Karolinehc
- Reviewed by: Karolinehc
- Editor: Karolinehc
Categories: Google Analytics Marketing Analytics
Tags: Python Conversion Optimization Data Analysis Data-driven Decisions GA4 Google Analytics Google Colab SQL Traffic Analysis
The content presented in this article is intended solely for academic purposes. The opinions expressed are based on my personal understanding and research. It’s important to note that the field of big data and the programming languages discussed, such as Excel, Python, R, Power BI, Tableau, and SQL, are dynamic and constantly evolving. This article aims to foster learning, exploration, and discussion within the field rather than provide definitive answers. Reader discretion is advised.
Dataset: December 2025, January & February 2026
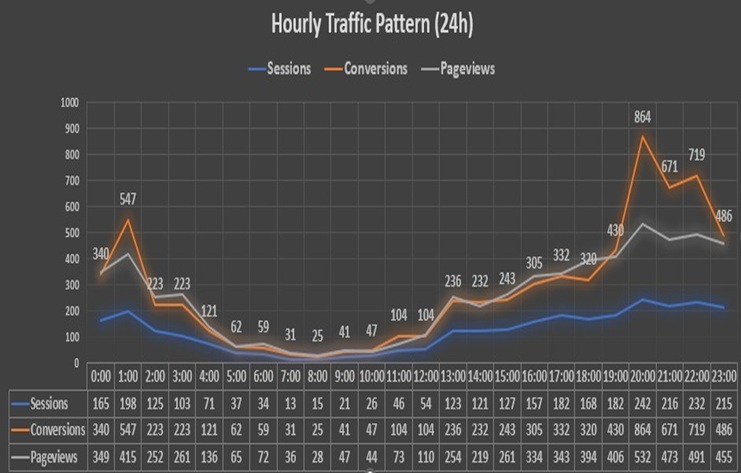
1. Hourly Performance (24-Hour Cycle)
This analysis breaks down traffic across a full day using three key metrics:
- Sessions – Number of visits
- Conversions – Completed goals (purchases, sign-ups, etc.)
- Pageviews – Total pages viewed
Key Observations
Midnight – Early Morning (0:00 – 8:00)
- Traffic is very low (13–198 sessions)
- Conversions are disproportionately higher than sessions at midnight
- Users in this window are highly engaged despite low volume
Morning Lull (8:00 – 12:00)
- Traffic drops to its lowest point (13–54 sessions)
- This is our dead zone — very few users are active
- Conversions and pageviews mirror this low activity
Afternoon Ramp-Up (13:00 – 18:00)
- Sessions climb steadily: 123 → 182
- Conversions follow a similar pattern: 236 → 332
- Natural workday peak starting after lunch
Evening Peak (19:00 – 23:00)
- This is our golden window — traffic spikes dramatically
- 20:00 is the absolute peak: 242 sessions, 864 conversions, 532 pageviews
- Conversion activity at 20:00 is 3.5× higher than sessions — users completing multiple goals per visit
- High engagement continues through 22:00 and 23:00
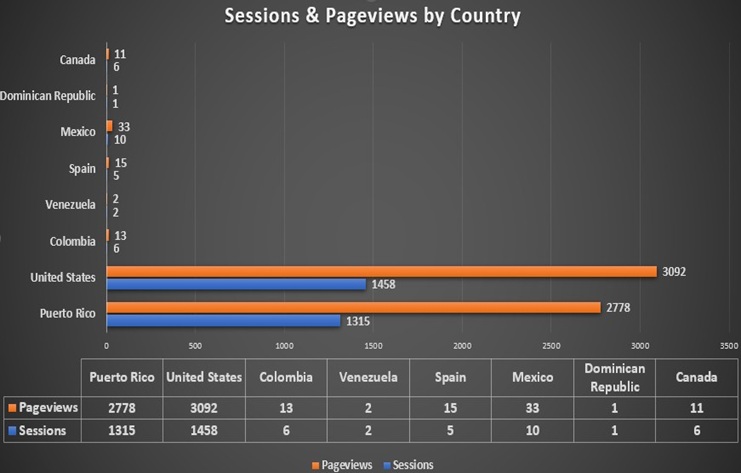
2. Geographic Performance by Country
This visualization breaks down traffic by country of origin:
- Sessions – Total visits
- Pageviews – Total pages viewed
- Users – Unique visitors
Key Observations
🇺🇸 United States – Our Primary Market
- 1,458 sessions from 3,414 users → Users > Sessions
- This suggests User count is inflated — possibly counting returning users across a longer period, while sessions are from a shorter window
- Pageviews (3,092) are solid: about 2.1 pages per session
Puerto Rico – Our Surprise Star
- 1,315 sessions from 2,778 users → again, Users > Sessions
- Pageviews (2,778) nearly identical to Users count
- Puerto Rico is almost as important as the US for our traffic
- Why? Spanish-language site + targeted campaigns + product appeal in PR
The Rest – Barely Registering
- Mexico: 10 sessions, 23 users
- Colombia: 6 sessions, 13 users
- Spain: 5 sessions, 15 users
- Canada: 6 sessions, 11 users
- Venezuela: 2 sessions, 1 user
- Dominican Republic: 1 session, 2 users
- Combined: less than 1% of total traffic
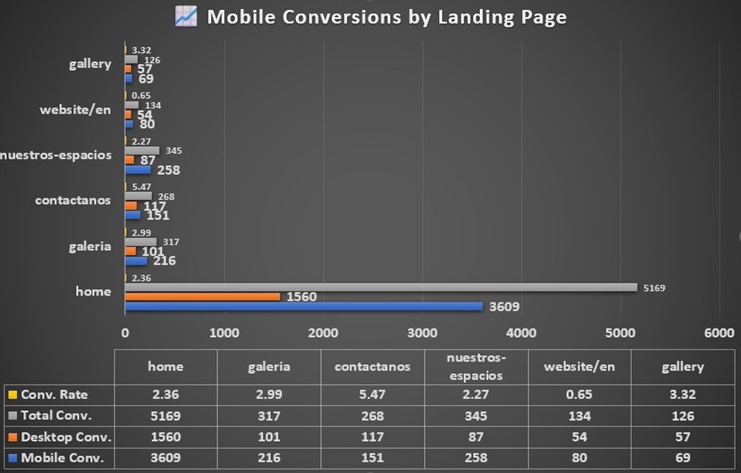
3. Landing Page Performance
This breaks down performance by first page users land on:
- Sessions – Total visits starting on that page
- Pageviews – Total views of that page (including subsequent views)
- Conversions – Goal completions
- Avg Pages/Session – How deeply users explore after landing
Key Observations
“home” – Our Workhorse Page
- 2,186 sessions (overwhelming majority)
- 5,230 conversions → 2.4 conversions per session
- 2.87 pages/session → solid engagement
- This is our primary entry point — people come here and take multiple actions
“galeria” (Spanish) & “gallery” (English)
- Both have the highest conversion intensity — users complete 3+ actions per session
- Gallery content is highly engaging and drives action
- Spanish version (“galeria”) gets nearly 3× more traffic than English (“gallery”)
- Consistent with our Puerto Rico dominance
“contactanos” – The Intent Signal
- Only 49 sessions, but 273 conversions = 5.6 conversions per session
- 3.49 pages/session → users explore deeply
- This is a high-intent page — people landing here are ready to engage
- But: underperforming in attracting traffic — only 49 sessions vs. 2,186 for home
“nuestros-espacios” – Strong Performer
- 152 sessions, 348 conversions → 2.3 conversions/session
- 3.29 pages/session → good depth
- Solid, consistent performance
Language Split – Spanish vs. English
- Spanish version (“sitioweb/es”) → higher engagement (3.72 pages/session vs. 2.84)
- English version (“website/en”) → gets 3× more sessions (206 vs. 70)
- Language mismatch: English speakers come, but Spanish speakers engage more deeply
“instrucciones-como-llegar” – The Outlier
- Only 7 sessions, but 208 conversions = 29.7 conversions per session
- 2.78 pages/session → average depth
- This is a directions page — users landing here are already committed
- Completing location-based actions: “get directions,” “save address,” “call”
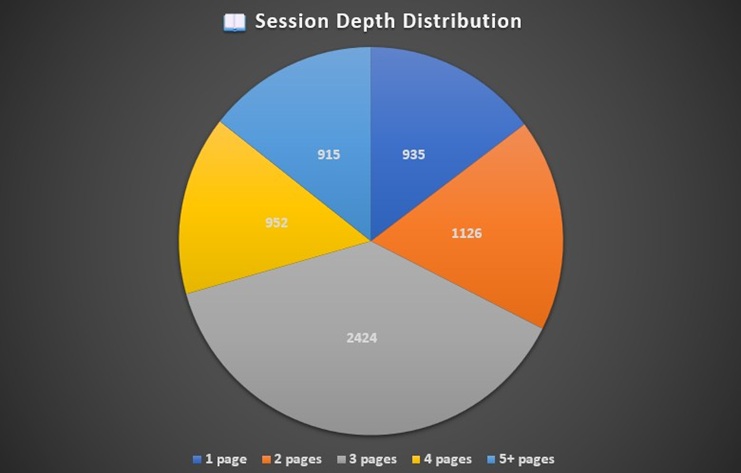
4. Pages per Session Distribution
This visualization breaks down sessions by how many pages users viewed:
| Pages | Description |
|---|---|
| 1 page | Users who bounced or left immediately |
| 2 pages | Users who viewed one additional page |
| 3 pages | Users who explored a bit deeper |
| 4 pages | Users who were fairly engaged |
| 5+ pages | Users who were highly engaged and explored deeply |
Key Observations
The 3-Page Sweet Spot
- Nearly 40% of users view exactly 3 pages
- Natural browsing pattern:
- Land on a page
- Click to a second page
- Click to a third page
- Then leave
The Bounce Rate Story
- 1-page sessions = 935 (14.7%)
- This is our bounce rate — users who entered and left without interacting further
- 14.7% is EXCELLENT. Most sites would kill for this.
- It means:
- Users are finding what they’re looking for
- Content is compelling
- Navigation is working
- You’re attracting the right audience
The Deep Engagement Story
- 5+ pages = 915 (14.4%)
- Nearly 15% of users view 5+ pages — deep engagement
- These are power users — genuinely interested, researching, or completing multiple actions
- Combined with 4-page group:
- 4+ pages = 1,867 sessions (29.4%)
- Almost 30% of users view 4+ pages
- This is exceptional engagement
Summary: What We Learned
| Finding | Insight |
|---|---|
| Evening peak (20:00) | Golden hour — 3.5× more conversions than sessions |
| Puerto Rico | Almost as important as the US — Spanish content works |
| Gallery pages | Conversion engines — 3+ actions per session |
| Contact page | High intent, low traffic — needs promotion |
| Bounce rate | 14.7% — exceptionally low |
| Deep engagement | 30% view 4+ pages — exceptional |
Video about this Post
What’s Next?
In Part 2, we’ll dive deeper into:
- Device behavior — mobile vs. desktop breakdown
- Traffic sources — where your best users come from
- Medium performance — organic vs. referral vs. direct
¿Do you want me to analyze your Google Analytics data? 📩 DM to discuss a custome analysis.
Frequently Asked Questions
What time of day drives the most conversions?
20:00 (8 PM) is the peak hour — 242 sessions and 864 conversions, making it the most valuable traffic window.
Which country is the unexpected top market?
Puerto Rico performs nearly as well as the US — 1,315 sessions with excellent engagement, making it a hidden growth opportunity.
Is the bounce rate high?
No — only 14.7% of sessions are single-page visits. That’s an exceptionally low bounce rate for any website.