- 23 Mar, 2023
- read
- Karolinehc
Categories: Cryptocurrency Data Analysis
Tags: Python Pandas Data Manipulation Crypto BNB BTC ETH USDC USDT Matplotlib
The content presented in this article is intended for academic purposes only. The opinions expressed are based on my personal understanding and research. It is important to note that the field of big data and the programming languages discussed, such as Python, R, Power BI, Tableau, and SQL, are dynamic and constantly evolving. This article is intended to encourage learning, exploration, and discussion within the field rather than provide definitive answers. Reader discretion is advised.
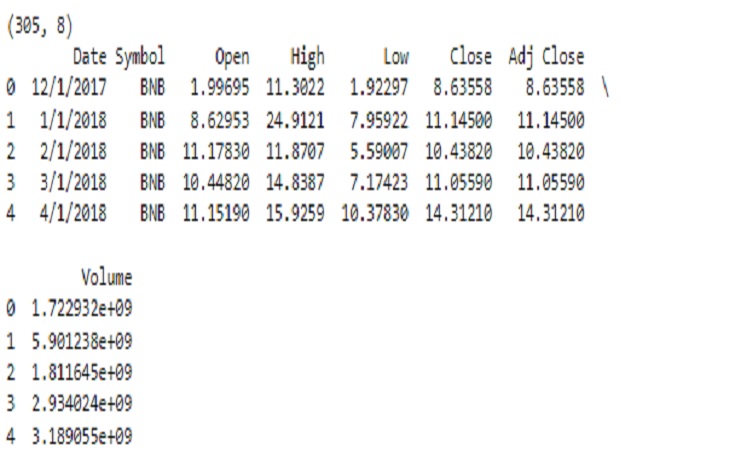
Since each cryptodata DataFrame contains a date column and a closing column, we can concatenate them across the rows using pd.concat() and get a single data DataFrame containing all the data.
"import pandas as pd

# read in all data frames

BNB = pd.read_csv(r'D:\helen\Documents\PythonScripts\datasets\yahoocrypto\BNB-USD.csv')
BTC = pd.read_csv(r'D:\helen\Documents\PythonScripts\datasets\yahoocrypto\BTC-USD.csv')
ETH = pd.read_csv(r'D:\helen\Documents\PythonScripts\datasets\yahoocrypto\ETH-USD.csv')
USDC = pd.read_csv(r'D:\helen\Documents\PythonScripts\datasets\yahoocrypto\USDC-USD.csv')
USDT = pd.read_csv(r'D:\helen\Documents\PythonScripts\datasets\yahoocrypto\USDT-USD.csv')

# concatenate all data frames
merged_data = pd.concat([BNB, BTC, ETH, USDC, USDT], axis=0)

# check the shape of the merged data
print(merged_data.shape)

# check the head of the merged data
print(merged_data.head())"
OUTPUT

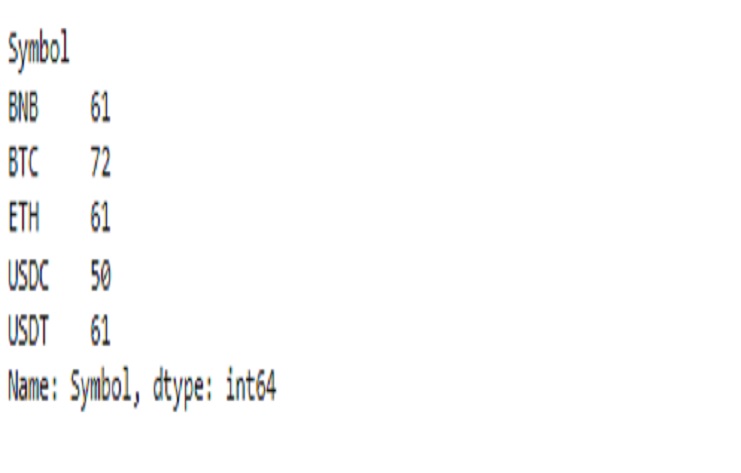
The code groups the combined data by the ‘Symbol’ column and then counts the occurrences of each “symbol” within each group. Provides information about the frequency or occurrence of different “symbols” in the data set.
merged_data.groupby(['Symbol'])['Symbol'].agg('count')
OUTPUT

The index represents the row labels of the DataFrame. So x will be a list containing these symbols and the value of the variable y which is the NumPy array containing the values of symbolData
x = list(symbolData.index)
x
OUTPUT
['BNB', 'BTC', 'ETH', 'USDC', 'USDT']
y = symbolData.values
y
OUTPUT
array([61, 72, 61, 50, 61], dtype=int64)
import matplotlib.pyplot as plt
%matplotlib inline
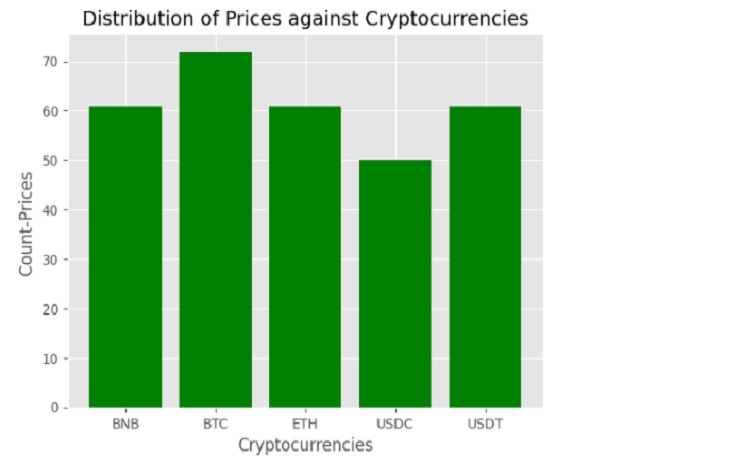
plt.bar(x, y, color='green')
plt.xlabel("Cryptocurrencies")
plt.ylabel("Count-Prices ")
plt.title("Distribution of Prices against Cryptocurrencies")
plt.show()
OUTPUT
