
- 23 Sep, 2023
- read
- Karolinehc
Categories: Visualización de Datos Inteligencia de Negocios
Tags: Power BI Power Query Modelado de Datos Merge Queries Transformación de Datos Visualización Análisis de Datos
The content presented in this article is intended solely for academic purposes. The opinions expressed are based on my personal understanding and research. It’s important to note that the field of big data and the programming languages discussed, such as Python, R, Power BI, Tableau, and SQL, are dynamic and constantly evolving. This article aims to foster learning, exploration, and discussion within the field rather than provide definitive answers. Reader discretion is advised.
Let’s start in the Power Query Editor within Power BI, which is where we can perform data transformations on our dataset.
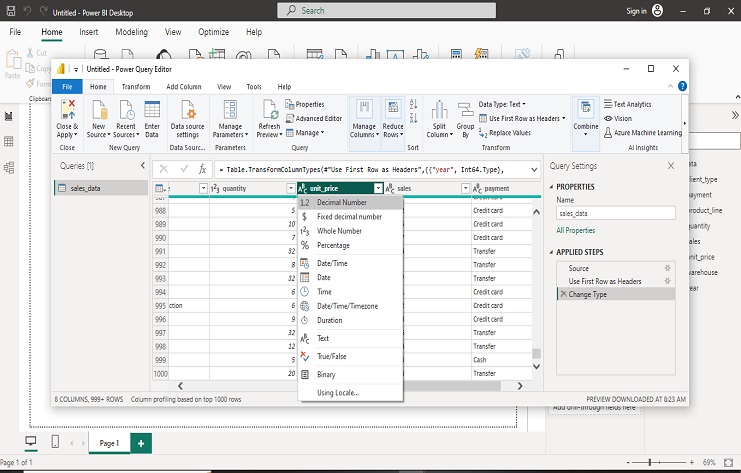
To change the data type of a column within the Power Query Editor in Power BI, you can follow these steps:
Opening Power Query Editor: In Power BI, at “Home” tab, we click on “Edit Queries.” This will open the Power Query Editor.
Selecting the Column: In the Power Query Editor, we select the column for which we want to change the data type. Clicking on the column header to select it.
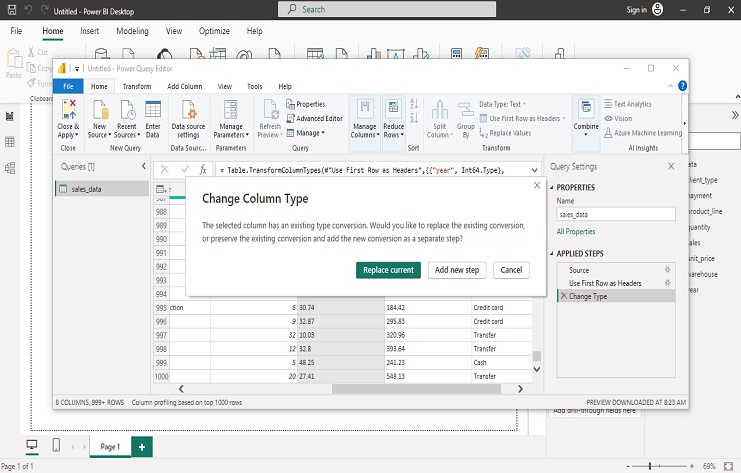
after that, Changing the Data Type:
Right-click on the selected column header. From the context menu, hover over “Change Type.” A sub-menu will appear with various data type options such as Text, Whole Number, Decimal Number, Date, etc. We Click on the desired data type to change the column’s data type. Apply Changes: After selecting the new data type, Power Query will automatically try to convert the data in the column to the chosen data type.
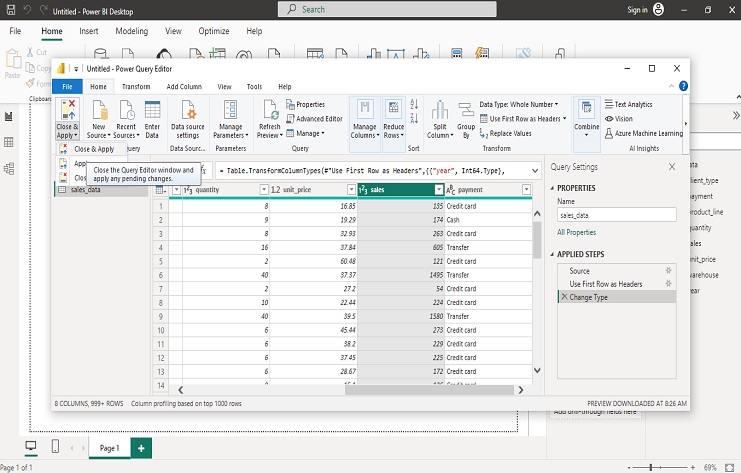
To load a new dataset and join or merge it with an existing dataset in Power BI, both datasets should have a common column, which in our case is “year.” Here’s how we can do it:
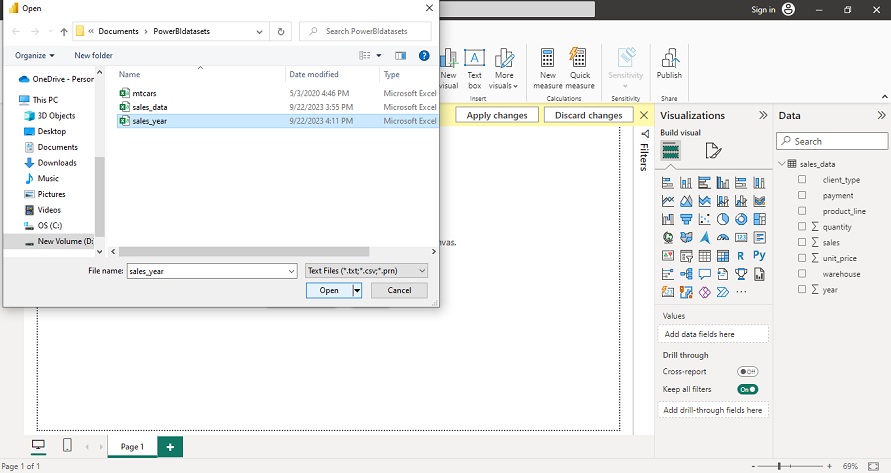
Loading the New Dataset:
In Power BI, We go to the “Home” tab. Click on “Edit Queries” to open the Power Query Editor. We select Queries to Merge:
In the Power Query Editor, we select the queries (tables) that we want to merge. Merge Queries:
We go to the “Home” tab in the Power Query Editor. Click on “Merge Queries” in the “Combine” group. We choose the type of merge we want to perform (e.g., Inner, Left Outer, Right Outer, Full Outer) and specify the join columns (e.g., “year” in our case) between the queries. Configure Merge Options:
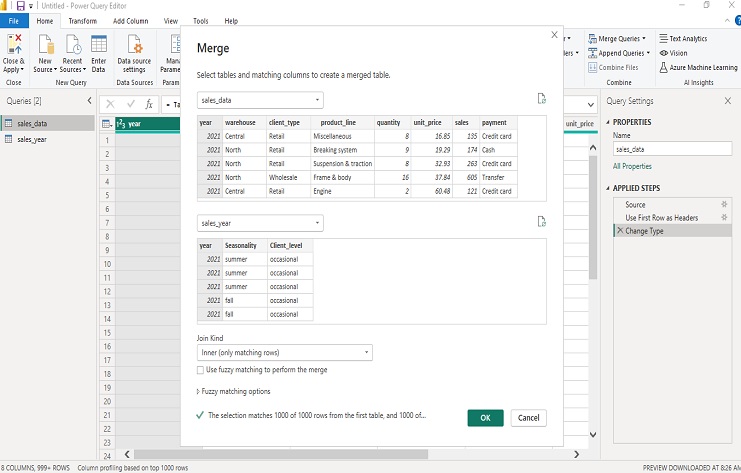
Configure the merge options, such as choosing which columns to include from each query, renaming columns, or choosing the join type. Apply Merge:
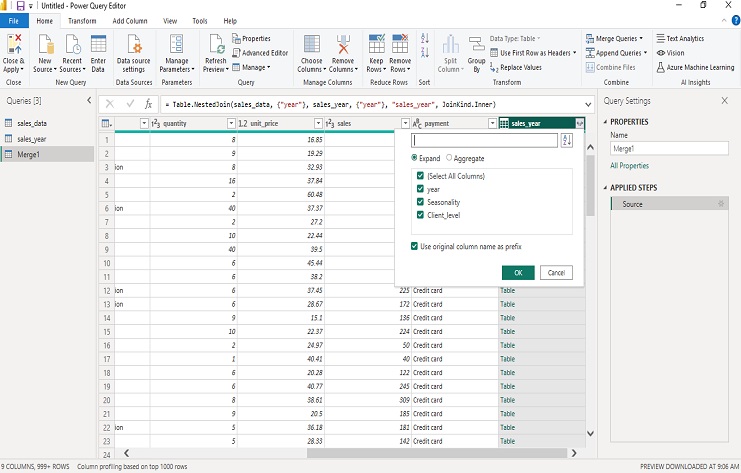
Click the “OK” or “Apply” button to apply the merge operation. Review and Load Data:
We review the merged data in the Power Query Editor to ensure it’s what we expect. If everything looks correct, we click “Close & Apply” to load the merged data into our Power BI model.
Great! Now that we have our data loaded and potentially merged in Power BI, we can start creating visualizations to analyze and present our data:
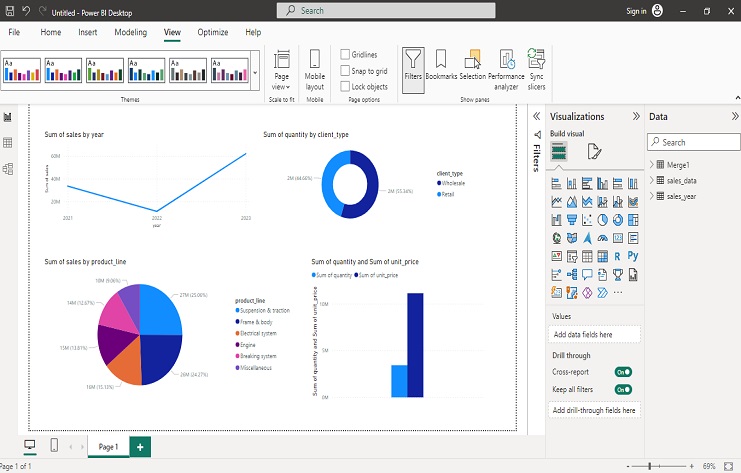
Using the Visualization pane on the left side of Power BI to select a graph type and then dragging and dropping fields into the axis and values wells is a straightforward way to create visualizations.