- 23 Jul, 2023
- read
- Karolinehc
Categories: Data Analysis Python Projects
Tags: Multiple Regression Job Experience Education Income Prediction Pandas Statsmodels Marital Status Linear Modeling Python
The content presented in this article is intended solely for academic purposes. The opinions expressed are based on my personal understanding and research. It’s important to note that the field of big data and the programming languages discussed, such as Python, R, Power BI, Tableau, and SQL, are dynamic and constantly evolving. This article aims to foster learning, exploration, and discussion within the field rather than provide definitive answers. Reader discretion is advised.
import pandas as pd
import numpy as np
import seaborn as sns
import matplotlib.pyplot as plt
from statsmodels.formula.api import ols
marketing1 = pd.read_csv(r'D:\helen\Documents\PythonScripts\datasets\kaggle\ifood_df.csv')
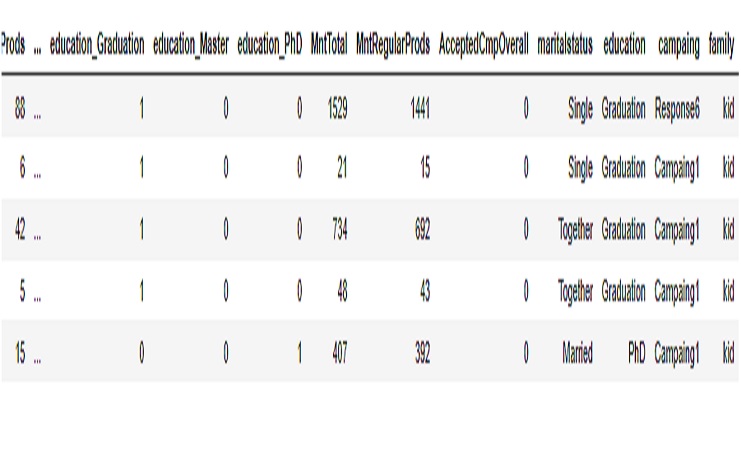
marketing1.head()
OUTPUT

Lest creat a new column
The function called YearsEducation that takes a row of data as input and calculates the total number of years of education based on the education level specified in the row. The function iterates over different education levels (education_PhD, education_Master, education_Graduation, education_Basic) and adds the corresponding number of years to the years variable.
def YearsEducation(row):
    years = 0

    if row['education_PhD'] == 1:
        years += 2  # Add 2 years for PhD

    if row['education_Master'] == 1:
        years += 2  # Add 2 years for master's degree

    if row['education_Graduation'] == 1:
        years += 5  # Add 5 years for graduation

    if row['education_Basic'] == 1:
        years += 10  # Add 10 years for basic

    years += 1  # Add 2 years for basic PhD
    years += 1  # Add 2 years for Master
    years += 3  # Add 5 years for Graduation
    years += 5  # Add 10 years for Basic


    return years

marketing1['YearsEducation'] = marketing1.apply(YearsEducation, axis=1)
Lest creat a new column - variable
Lest do the same with JobExperience
def JobExperience(row):
    years = 0

    if row['education_PhD'] == 1:
        years += 2  # Add 2 year of JobExperience

    if row['education_Master'] == 1:
        years += 2  # Add 2 years of JobExperience

    if row['education_Graduation'] == 1:
            years += 5  # Add 5 years of JobExperience

    if row['education_Basic'] == 1:
                years += 1  # Add 1 years of JobExperience

    years += 1  # Add 1 years for PhD
    years += 1  # Add 2 years for Master
    years += 3  # Add 5 years for Graduation
    years += 1  # Add 1 years for Basic

    return years

marketing1['JobExperience'] = marketing1.apply(JobExperience, axis=1)
Lest creat a new column - variable to complete the model
Calculate the square of the number in Python using the pow() method. JobExperienceSquare
marketing1['JobExperienceSquared'] = marketing1['JobExperience'].apply(lambda x: pow(x, 2))
Lest calculate the Multiple Regression Model for those variables that already were created
Income_vs_YearsEducation1 = ols("Income ~ YearsEducation + JobExperience + JobExperienceSquared",
                        data=marketing1).fit()
print(Income_vs_YearsEducation1.params)
OUTPUT
Intercept                4306.238982
YearsEducation          -3482.609229
JobExperience           17753.208824
JobExperienceSquared     -788.168509
dtype: float64
The intercept value of 4306.238982 represents the estimated income when the YearsEducation is zero. The coefficinet for the YearsEducation variable is -3482 indicating that on average, for each additional year of education, the expected income decrease by approximately $3482 and for each year of JobExperience the Income earned will be $17753 and the JobExperienceSqueared is positive until certain point where it will start to decrease by -788 the Income
Lest includ the categorical variable maritalstatus in the regression model without using dummy coding or one-hot encoding. Instead, lets use the levels of the variable as parameters in the model formula.
Income_vs_numcateg = ols("Income ~ YearsEducation + JobExperience + JobExperienceSquared + maritalstatus + 0",
                        data=marketing1).fit()
print(Income_vs_numcateg.params)
OUTPUT
maritalstatus[Divorced]     5168.166512
maritalstatus[Married]      4660.514211
maritalstatus[Single]       4707.647165
maritalstatus[Together]     4927.548932
maritalstatus[Widow]        9181.141773
YearsEducation             -3469.387292
JobExperience              17571.756723
JobExperienceSquared        -778.507442
dtype: float64
Here is an interpretation:
maritalstatusDivorced: On average, individuals who are divorced have an estimated increase in income of $5.168.17 units compared to the reference level. maritalstatusMarried: On average, individuals who are married have an estimated increase in income of $4.660.51 units compared to the reference level. maritalstatusSingle: On average, individuals who are single have an estimated increase in income of $4.707.65 units compared to the reference level. maritalstatusTogether: On average, individuals who are in a relationship (together) have an estimated increase in income of $4.927.55 units compared to the reference level. maritalstatusWidow: On average, individuals who are widowed have an estimated increase in income of $9.181.14 units compared to the reference level.
Additionally, negative coefficient values for YearsEducation suggest that an increase in years of education is associated with a decrease in income, all else being equal. Positive coefficients for JobExperience and JobExperienceSquared suggest that higher levels of job experience (and its squared term) are associated with higher income.